Server Monitor Laravel App
Product Overview
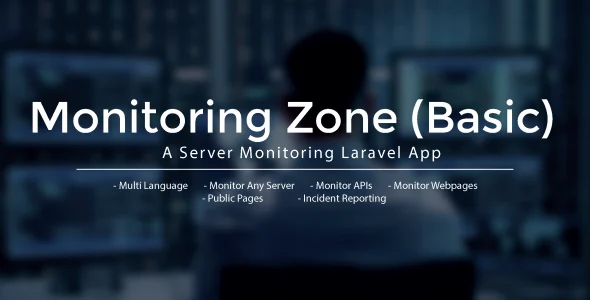
Running a smooth online presence often means keeping a vigilant eye on your backend infrastructure. The Server Monitor is a dedicated Laravel App designed to provide real-time insights into your server’s health and performance. It’s built for developers, system administrators, and anyone managing critical web applications, offering a centralized dashboard to track server activity, resource consumption, and potential issues across multiple machines efficiently.
Once the agent is configured on your servers, the main dashboard immediately presents a clear overview of your entire fleet. You’ll see critical metrics like CPU usage percentages, current RAM consumption, and available disk space for each connected server. The interface effectively uses color-coded progress bars and precise numerical values, making it straightforward to quickly gauge resource allocation and identify any anomalies without having to drill down into each server individually.
Highlights & Value
- The central dashboard aggregates data from multiple servers, each appearing as a distinct, color-coded card with its current operational status, CPU, RAM, and disk utilization readily visible.
- Real-time data refresh means the dashboard automatically updates every few seconds, showing live changes in CPU or memory usage graphs without needing manual page refreshes, providing an up-to-the-minute view.
- You can set custom, granular thresholds for CPU, RAM, or disk space for individual servers; the system then sends immediate notifications via email or Slack when these predefined limits are breached, preventing downtime.
- Clicking into any server’s card brings up a dedicated page with detailed historical graphs showing resource usage over custom timeframes – hourly, daily, weekly, or monthly trends are readily available for performance analysis.
- Adding a new server is a streamlined process involving entering its IP address and a unique agent key, which the Server Monitor Laravel App generates during setup, greatly simplifying the connection and authentication process.
Real-World Use Cases
- Monitoring a diverse portfolio of client websites hosted on various VPS instances, all from a single, unified control panel to ensure consistent uptime and performance.
- Proactively identifying and resolving resource bottlenecks on a busy e-commerce platform before they escalate and impact user experience during peak traffic periods or promotional events.
- Tracking critical background tasks by monitoring cron job execution status on a data processing server, ensuring all scheduled operations complete successfully and on time.
- Receiving immediate, actionable alerts on disk space filling up on a crucial log server or backup storage, preventing catastrophic server crashes due to lack of available storage.
- Ensuring the Server Monitor Laravel App itself is running optimally, with all its internal background workers active and processing monitoring data correctly, guaranteeing the system’s reliability.
Technical & Compatibility
Setting up the Server Monitor involves two main steps: deploying the main Laravel application on a dedicated hosting environment and then installing a small, lightweight agent script on each server you wish to monitor. The agent is designed for minimal overhead and primarily communicates back to the central Laravel instance via secure API calls. I found the installation instructions comprehensive and straightforward, primarily involving standard Composer install commands, database migrations, and configuring environment variables.
The core application generally requires PHP 8.x or newer, along with a robust MySQL or PostgreSQL database for efficient data storage and retrieval. For the actual monitoring, the agent needs SSH access or similar permissions to gather real-time system statistics effectively. It integrates seamlessly with common Linux distributions like Ubuntu and CentOS, reporting key metrics such as system load, active processes, network activity, and disk I/O without requiring complex, custom agent configurations. The Laravel App backend itself efficiently handles all data processing, storage, and presentation.